Studies on Stem Cells Research and Therapy
A New Catheter Technology to Deliver Vascular Stem-Cells
Brian D Plourde1, John R Stark2 and John P Abraham3*
2Kansas University, School of Engineering, USA
3University of St. Thomas, School of Engineering, USA
Cite this as
Plourde BD, Stark JR, Abraham JP (2016) A New Catheter Technology to Deliver Vascular Stem-Cells. Studies on Stem Cells Research and Therapy 2(1): 007-016. DOI: 10.17352/sscrt.000007A new device has been designed, developed and tested to improve the capacity of vascular drug and stem cell delivery. The device consists of a catheter with a multitude of small lumens (instead of a large central channel lumen). The use of multiple lumens provides a number of benefits to medical intervention. First, the multiple lumens are spread across the catheter cross section. As a consequence, the medication/stem cells are more effectively dispersed into the artery. Second, the construction of the new catheter has an increased mechanical strength compared to the standard single-lumen catheter – therefore, it is able to resist compressive forces caused by a pressurized balloon. This fact makes the new design able to preserve medication/stem cell flowrates without causing mechanical hemolysis to the cells. Finally, the newly designed device prohibits clumping of stem cells carried in solution.
Introduction
A major cause of death in the developed world, and increasingly in developing countries stems from failure of the cardiovascular system. While cardiovascular diseases have many different manifestations, myocardial infarction (heart attacks) are among the most common. They occur when coronary arteries that supply blood to the heart become occluded through the progressive buildup of arterial plaque and inflammation.
An outcome of infarction is the injury or death of cardiac tissue which leads to other related health problems. Treatment of this type of cardiovascular disease typically first involves dietary and lifestyle changes to reduce the presence of clogging cholesterols within the blood, cholesterol medication, and surgical intervention. Among the most common surgical interventions are balloon angioplasty, stenting, medicated stenting [1-7], atherectomy [8-25], or a combination treatment. One positive outcome of these treatments is that they often increase the compliance of the artery wall which is a measure of cardiovascular health [26-35].
When preventative treatments are not effective, an infarction incident occurs and loss of life or permanent cardiovascular damage may occur. With tissue damage, post-infarction treatment may be used and among possible treatment options is the direct injection of stem cells into the injured area where the cells may stimulate cardiac muscle regeneration.
During the procedure, a wire-guided catheter is positioned just upstream of the injury and a balloon is sometimes inflated to temporarily occlude blood flow and open the artery. The stem cells are injected into the artery and the hope is that the cells fully wash the tissue walls which bound the flow.
A prerequisite to the treatment is that the cells must contact the tissue and therefore, the fluid mechanics of the injection device must be given consideration. In fact, while the present application is for stem cell injection, the technique which is described here is not limited to that treatment. Extension to non-living medication injections is straightforward.
With the background discussed, the remainder of this manuscript describes the design, analysis, and performance of a multi-lumen injection catheter that has been previously mentioned in the scientific literature but not in an all-encompassing single manuscript.
Methods
The investigation carried out here has two major parts. First, experiments were performed on both single- and multi-lumen catheters to investigate the fluid mechanic behaviors. Among the issues dealt with was the potential of the catheter to cause cellular injury to the injectant when used with an inflated balloon. Changes to the viability of cells were obtained before and after the injectant is passed through the catheter. Also, benchtop experiments were performed to determine how resistant the two catheter designs are to the compressive pressure of a balloon.
The second part of the study is numerical. A mathematical model was constructed to calculate the flow field throughout the catheters for various flowrates, balloon pressures, and states of compression. The outcome from the simulations are multifold. First, predictions of cellular damage are obtained and compared with the results from the aforementioned experiments. Second, the distribution of the injectant are determined downstream of the catheter location and a comparison of the performance of the two catheters is made. In particular, the catheter which leads to a more uniform distribution of injectant within the artery is judged superior. Finally, by varying parameters such as viscosity and flowrate, the effect of these quantities on the catheter performance will be provided.
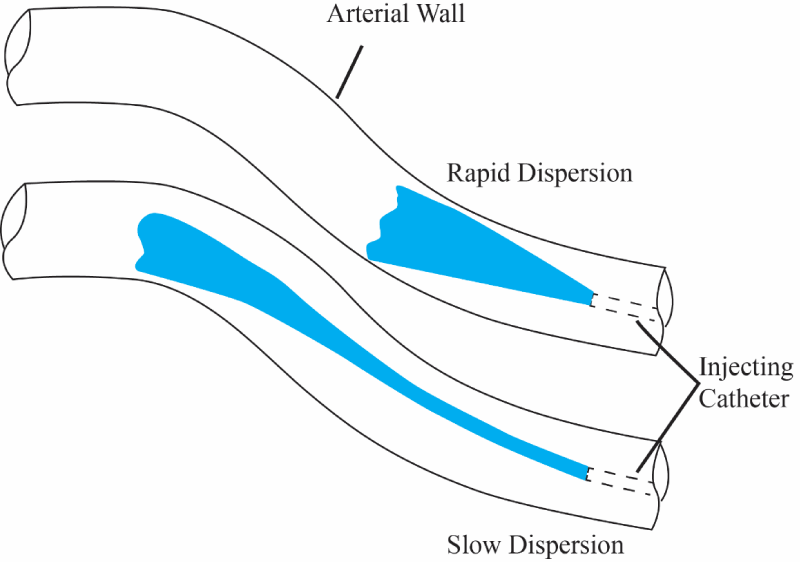
Figure 1 shows a drawing of the physical situation. In the figure, two situations are illustrated. In the first part of the image, an injectant is seen to rapidly spread into an artery (preferred result) while in the second portion, the injectant is seen to spread slowly (not preferred).
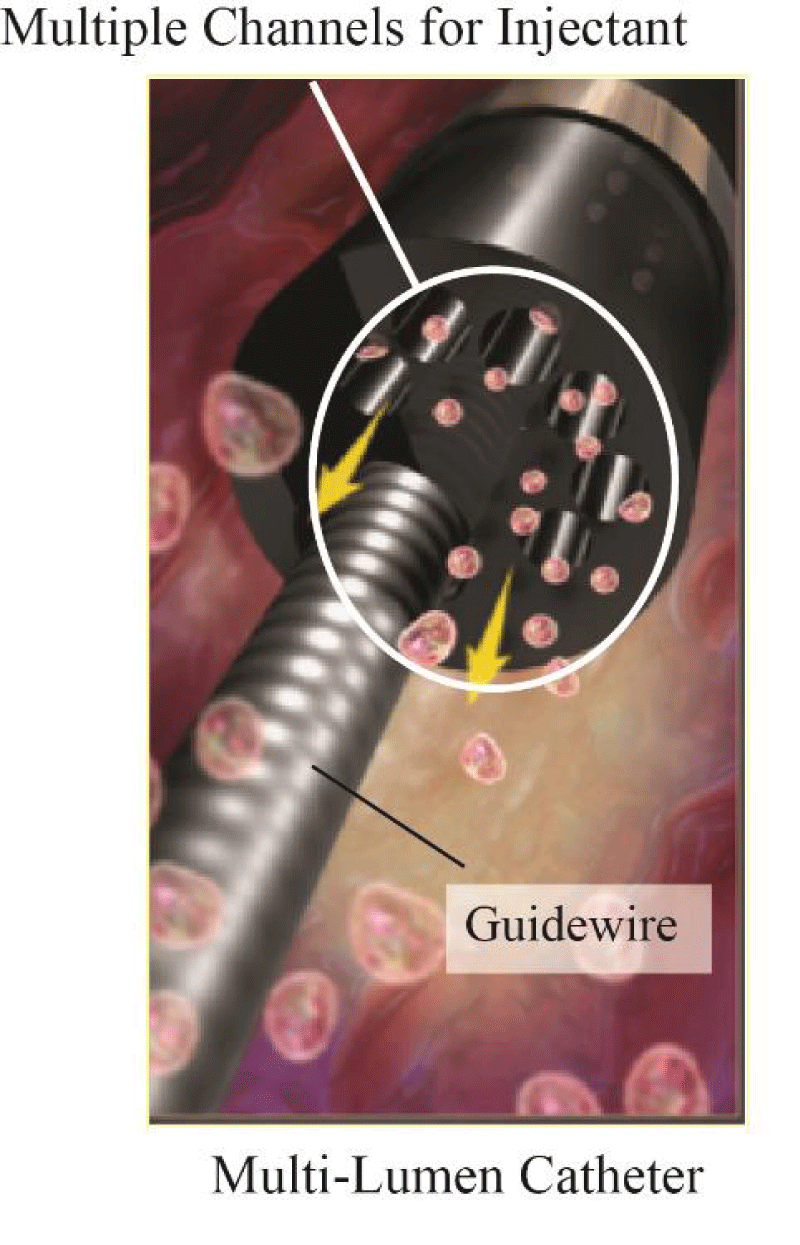
To better showcase the comparison between a single-lumen catheter and a multi-lumen catheter, Figure 2 has been prepared. There, an illustration of the multi-lumen catheter is provided. This catheter is termed the ND® Infusion Catheter which was also subject to prior published research [36-38].
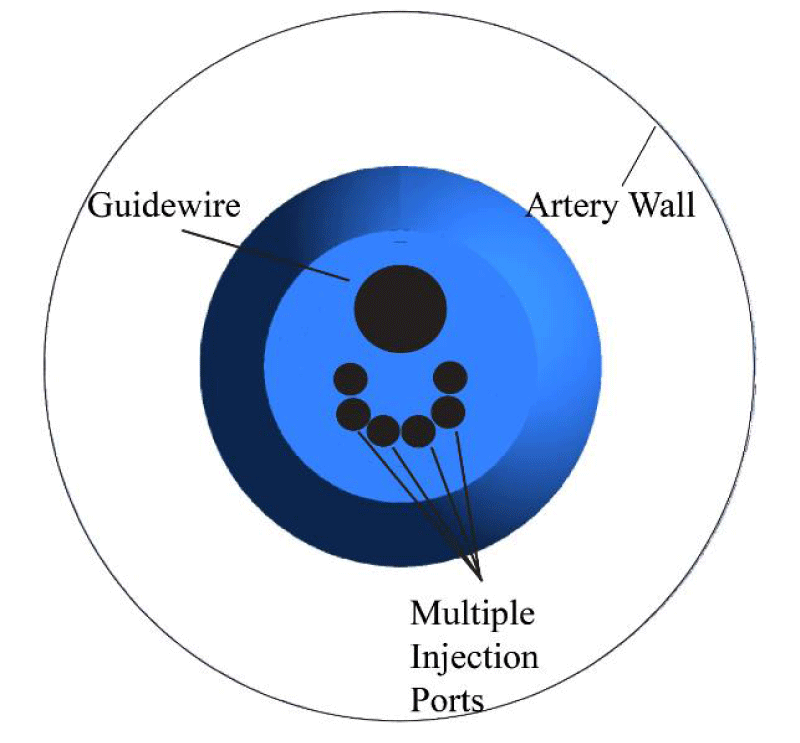
Preferably, the injection catheters would be positioned centrally within an artery, as shown in Figure 3. It is recognized that Figure 3 represents an idealized situation. In actual applications, the catheter would not be centrally located, the artery would not be circular, and in fact, the artery would not be straight. However, this idealization is used to demonstrate the efficacy of the numerical method which will be fully articulated later. Also, modern computational resources make extensions to non-straight, non-circular, and non-centrally located cases trivial. In fact, computational methods, combined with medical imaging technologies mean that it is possible to create patient-specific studies based on an individual patient’s artery dimensions [39]. While such patient specific studies have great importance for actual therapies, the vast range of differences from patient to patient make those types of studies irrelevant for generalized results.
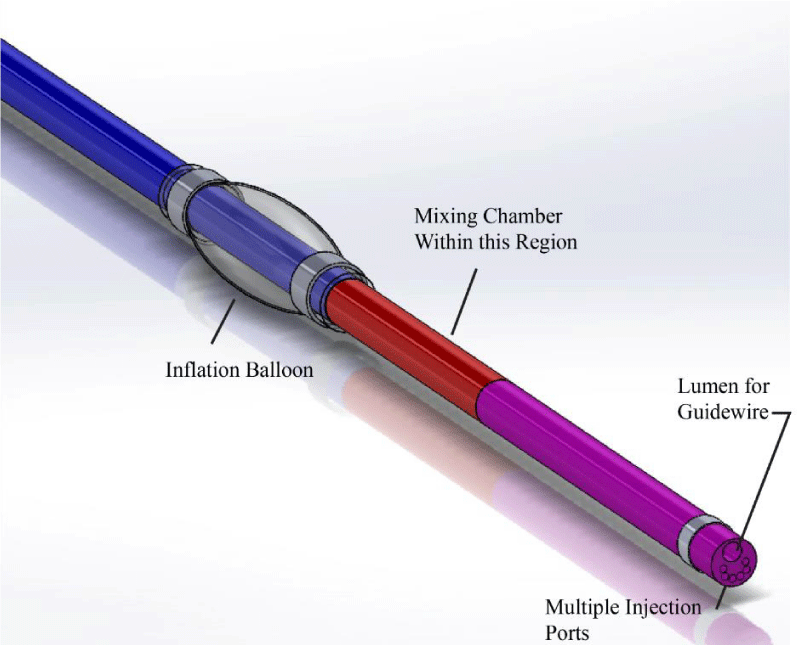
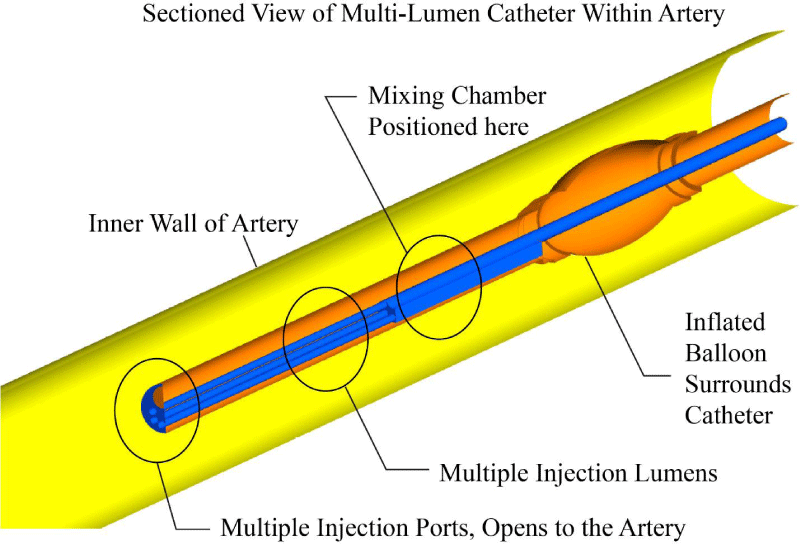
A computerized image of the multi-lumen ND® Infusion Catheter is provided in Figure 4. There, major components of the catheter are indicated by annotation. As seen in the image, there is a balloon that surrounds the catheter and is used for adjunctive angioplasty. The internal fluid passages include a mixing chamber that ensures a well-mixed fluid prior to injection into the artery. At the distal end of the artery are multiple ports which allow the injectant to enter into the artery.
More details of the system are shown in Figure 5. There, a sectioned view is provided so that the internal structures of the catheter can be seen.
The experiments
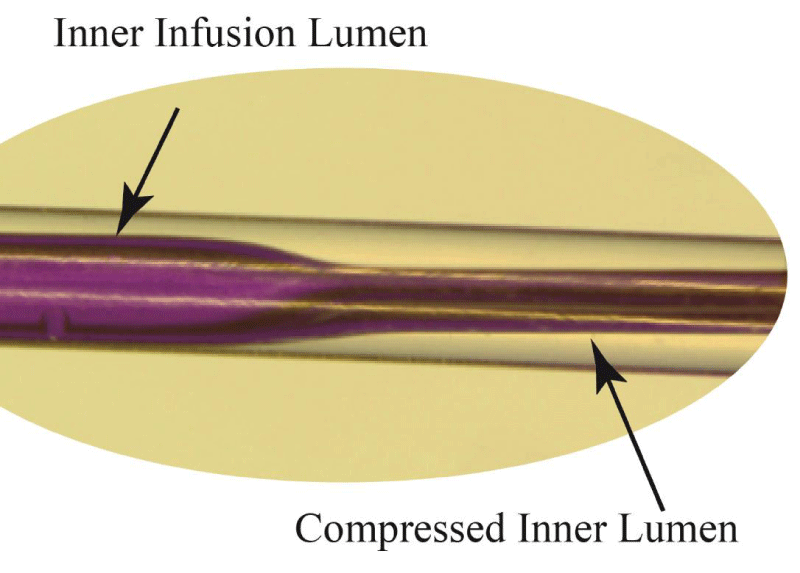
During the experiments on both the single- and multi-lumen catheters, the angio balloons were inflated. The inflation affected the channel opening within the catheters, as seen in Figure 6. There, a photograph of a standard single-lumen catheter is shown where balloon pressure has compressed the internal channel.
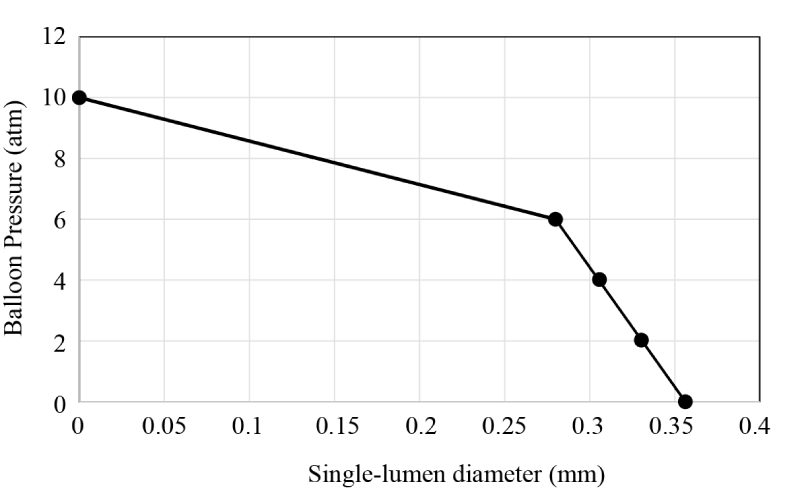
With the single-lumen catheter, balloon pressures were carefully recorded and sequentially increased. At each pressure setting, high-precision pin gauges were inserted into the lumen to determine the open diameter. For balloon pressures in the 0-6 atm range, the single-lumen catheter diameter decreased modestly. Then, for pressures in excess of 6 atm, the diameter decrease became much more rapid. At balloon pressures of approximately 10atm, there was very little remaining open area. Coincident fluid mechanic experiments showed that when the balloon pressure was approximately 10 atm or higher, the flowrate through the catheter decreased to almost no flow. Figure 7 shows a piecewise linear approximation of the open diameter as the balloon pressure increases. In the figure, data symbols are shown as markers.
Similar experiments were performed on the multi-lumen catheter. The multiple lumens have a diameter of 0.152 mm. When the surrounding balloon was pressurized, it was found that there was no measurable decrease in the diameter of the lumens (up to inflation pressures of 12 atm). This finding confirms that the multi-lumen device is compression resistant to these pressures.
The methods of cell infusion
Next, for the pressurized single- and multi-lumen catheters, an injectant was used. The purpose of this experiment was to assess whether the catheters have an adverse effect on the viability of cells carried in the injectant. The injectant contained 5 million MSC cells per ml of volume. The single lumen catheter (A Trek Coronary Dilatation Catheter, 3.5 by 15 mm, Abbot Vascular, Santa Clara, CA) and the multi-lumen catheter (ND® Infusion Catheter, Translational Research Institute, Gilbert, AZ) where the comparison devices. A contrast solution (50/50 with normal saline) was used to pressurize the balloons.
At the initiation of the experiment, the catheters were flushed with saline. Next, a 0.33 cc infusion of the cell solution was injected at 4ml/min. The catheters were then again flushed. Trypan blue was used to assess the viability of the cells. At each balloon pressure setting, seven replicate experiments were performed. For each catheter, experiments at pressures ranging from 0 atm to 12 atm were completed.
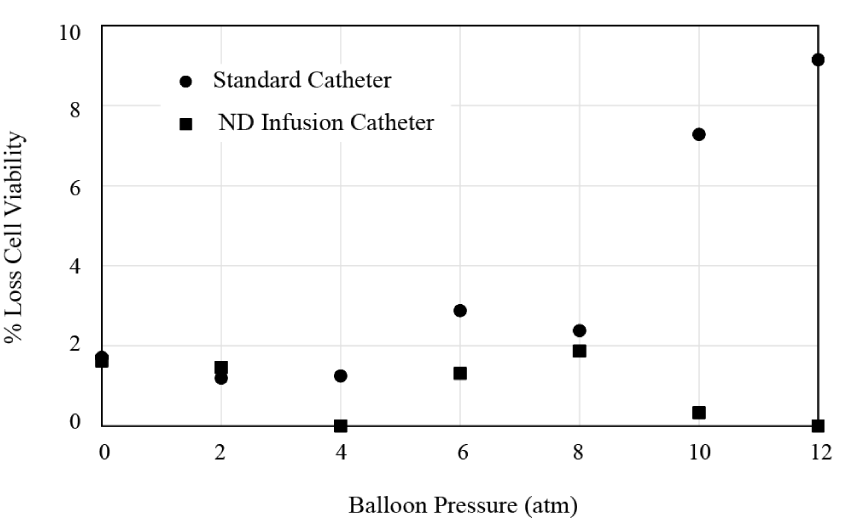
The results from the viability study are shown in Figure 8. It is seen that for both catheters, there is very little loss in cell viability for balloon pressures 8 atm or less. On the other hand, for pressures that exceed this value, the standard catheter leads to a marked decrease in cell viability. No change is observed for the ND Infusion multi-lumen catheter.
The numerical simulations
Next, numerical calculations of the fluid flow were performed. These calculations, commonly referred to as Computational Fluid Dynamics (CFD) are based on equations that govern conservation of mass and momentum within a flowing fluid.
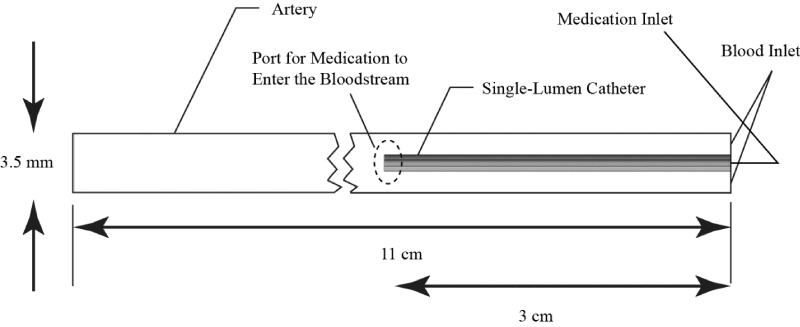
The boundary conditions used in the CFD analysis are shown in Figure 9. In that figure, flow passes from right to left. There are two inlets, one for blood and a second inlet for the injectant. At all fluid-solid interfaces, a no-slip condition is used. At the outlet, weak downstream conditions are employed (zero second derivative on all transported variables).
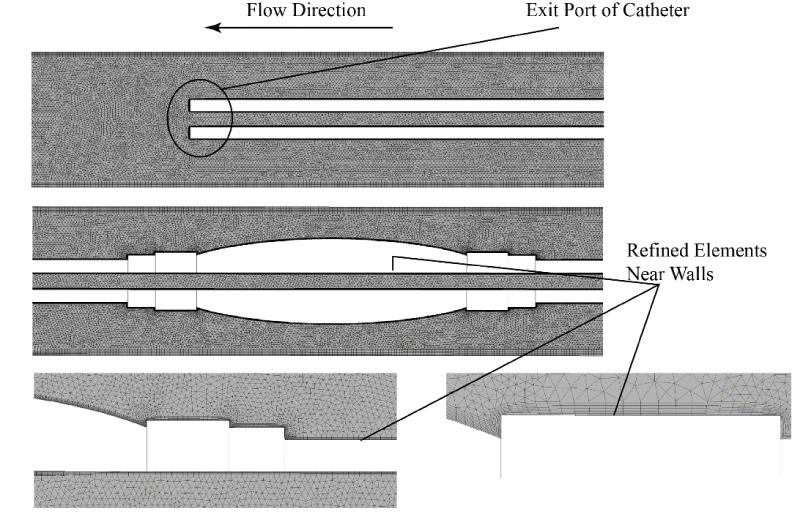
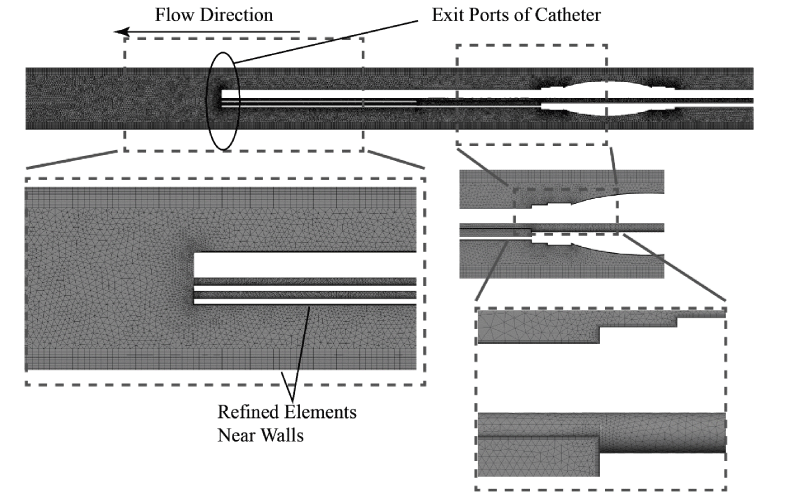
A necessary step in a computational analysis is the subdivision of the fluid region into a multitude of computational grid points (elements). The deployment of elements is optimal when the elements are more numerous at areas of interest or areas where the flow field changes rapidly. Depictions of the two computational meshes are provided in Figures 10 and 11, respectively, for the single-lumen and multi-lumen cases. The figures show a set of nested images that are increasing magnifications of the mesh. As seen in the figures the elements are locally concentrated at the walls of the catheter where high velocity gradients exist.
Because the flowrates were low, the flow was well within the laminar regime and a laminar solver was employed. The inlet velocity of the blood was extracted from cardiac-cycle averages. The relevant governing equations are those for concentration of species mass and momentum. The conservation of species equation is expressed as
for species k. The first term on the left is the unsteady variation in local concentration, the second term is the advection term. The term on the right side of the equation represents diffusion.
The conservation of momentum equation is
Here, tensor notation is used for compactness. The first term on the left is the unsteady change in local momentum. The second term is the advection of momentum within the fluid. On the right-hand side are the pressure gradient and shear-stress momentum terms.
In total, 16 different simulations were completed for various catheter designs, the presence or absence of a balloon, injectant viscosity, and injectant flowrate. A summary of the 16 cases is provided in Table 1.
As evident from Table 1, the first issue to be investigated is whether the presence or absence of the inflation balloon upstream of the injection affects the results. Next, different inlet conditions are explored which will be discussed in some detail later. Third, two different injectant viscosities are used which represent upper and lower bounds of typical carrying fluids. Finally, a low and high injection rate are studied.
When no inflation balloon is used, the blood flow is not occluded and a coronary artery flowrate of 60 cc/min was used as the blood inlet condition. With a balloon in place, the blood velocity was not known a priori however, it is expected that the overall pressure within the artery segment will be unchanged. Therefore, the resulting inlet pressures from the no balloon cases were used as input for the counterpart balloon calculations.
Blood was modeled as a non-Newtonian fluid with an Ostwald-de Waele constitutive model [40] that is
Here, K = 0.0147 (kg/m-s1.22) and n = 0.78 [41]. The blood model is similar to that described in [10].
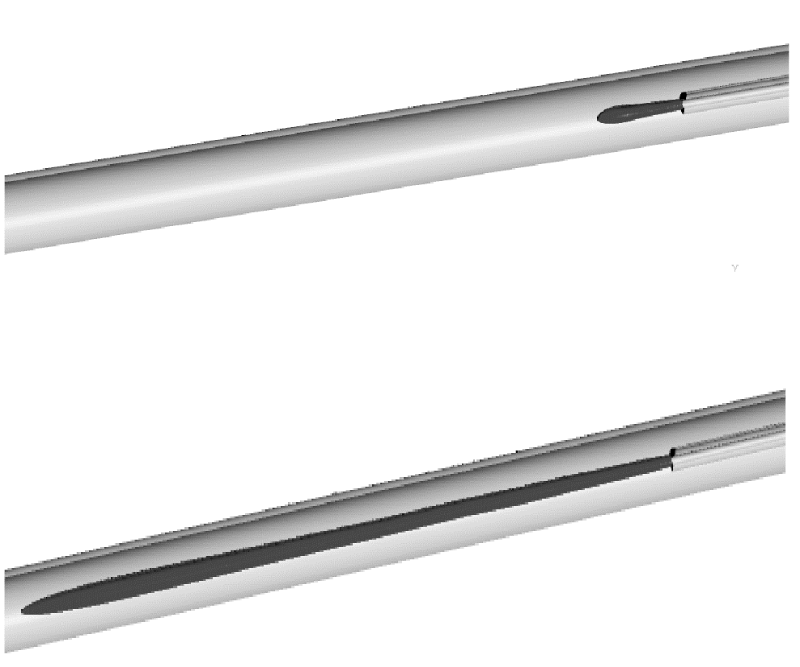
A demonstration of typical computational results is set forth in Figure 12. There, a bolus of injectant is seen emerging from the distal end of an injection catheter. The bolus can be defined by a predetermined concentration level (e.g. 10%, 1%). The spread of these concentration boluses can then be determined from the simulations and comparisons can be made between the different cases listed in Table 1.
Quantitative comparisons of the various results from the cases of Table 1 will be presented in a series of images.
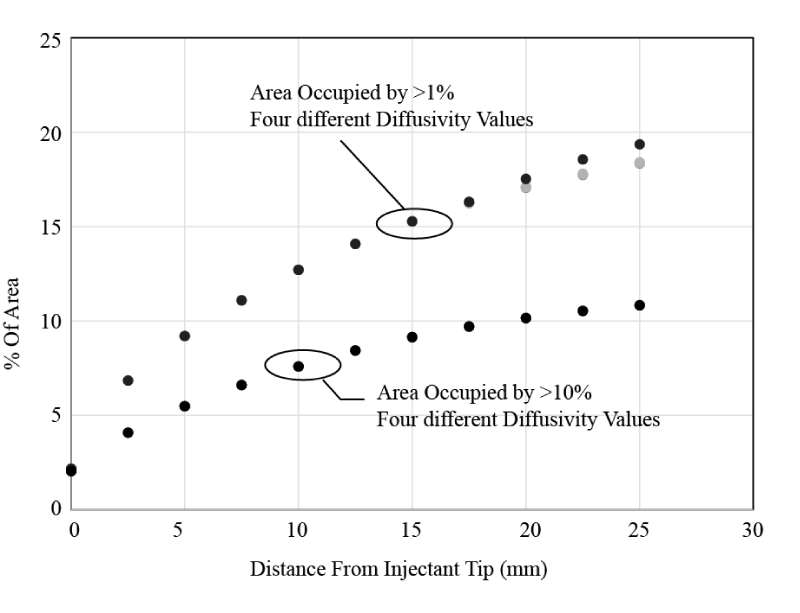
First, since the value of the diffusivity (D) from Eq. (1) is not known with great certainly, a sensitivity study was performed to assess its importance. Four versions of Case 1 from Table 1 were calculated. Each version used a different value for diffusivity (0, 1e-12, 1e-9, and 2e-9 m2/s). As seen in Figure 13, the percentage of cross sectional area occupied by concentrations of 1% or 10% was hardly affected by the diffusivity value (despite the very large range). These results show that the final outcome does not depend on the relatively uncertain value of the diffusivity. The clear conclusion from this is that the injection spread is driven almost entirely by advection and fluid mixing rather than by molecular diffusion.
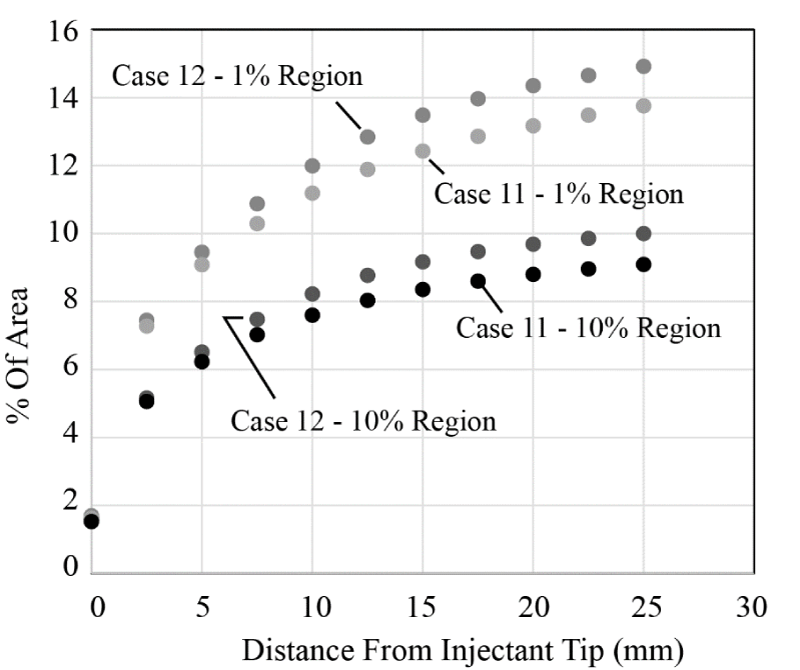
The general trends displayed in Figure 13 are expected. The injectant occupies increasingly greater cross sectional area at further locations downstream of the injection location. Furthermore, the lower concentration bolus (1%) occupies a much larger space than the higher concentration bolus (10%).
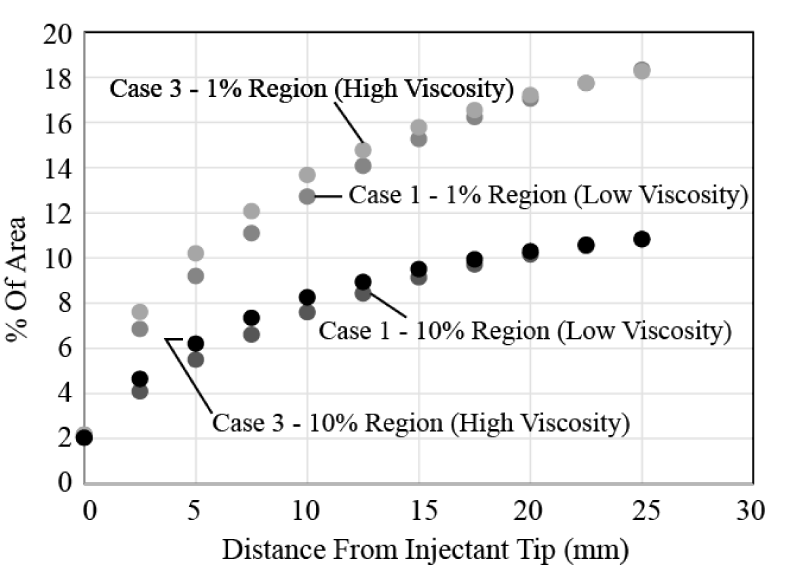
The next issue to be studied is whether the carrier fluid viscosity exerts an influence on the injectant spread. To test this, results from Case 1 and Case 3 from Table 1 are shown in Figure 14. Both results correspond to a single-lumen catheter; the cases differ by the carrying fluid. It is seen that there is virtually no difference in the results – so that viscosity is not an important factor. The results shown in Figure 14 are representative of other comparisons of low viscosity/high viscosity cases.
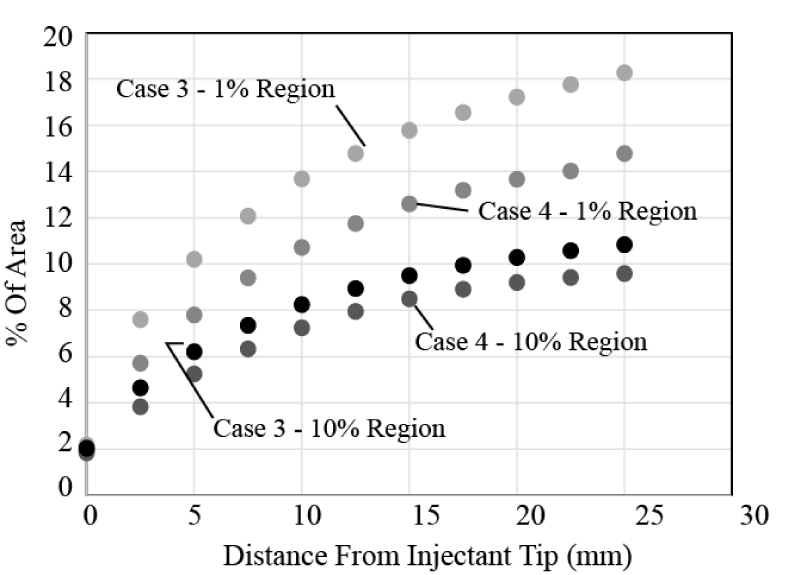
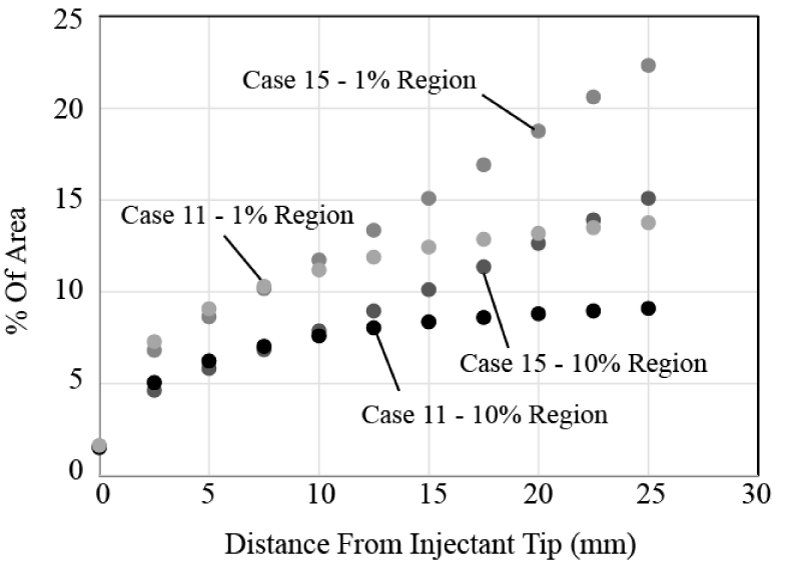
Next, the effect of the presence or absence of an upstream angio balloon is determined. Here, Cases 3 and 4 from Table 1 are compared. It is seen that the upstream balloon reduces the spread of both the 1% and 10% bolus regions and thereby would reduce the effectiveness of the injectant. The findings that are shown in Figure 15 are representative of other balloon/no balloon comparisons for the single-lumen catheter.
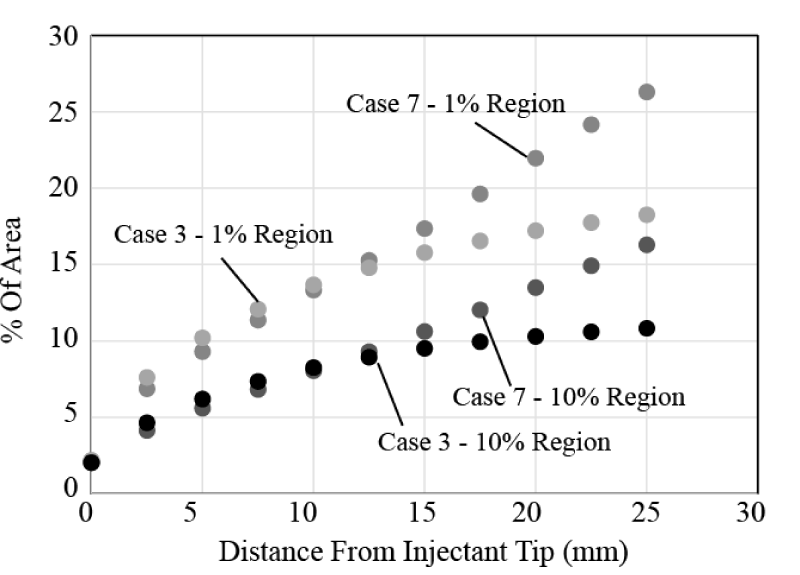
Next, the importance of flowrate is investigated. An example of the results is shown in Figure 15. There, Cases 3 and 7 are compared, which differ only in the injectant flowrate. Case 7 has twice the injectant flow (10 ml/min compared with 5 ml/min). It is seen that both the 1% and 10% bolus regions experience a notable increase in spread. In the region close to the injection location, there is almost no difference in spread. However, for longer distances from the catheter, beginning at approximately 15 mm, the two sets of results begin to diverge and the higher injectant flow spreads nearly linearly with downstream distance.
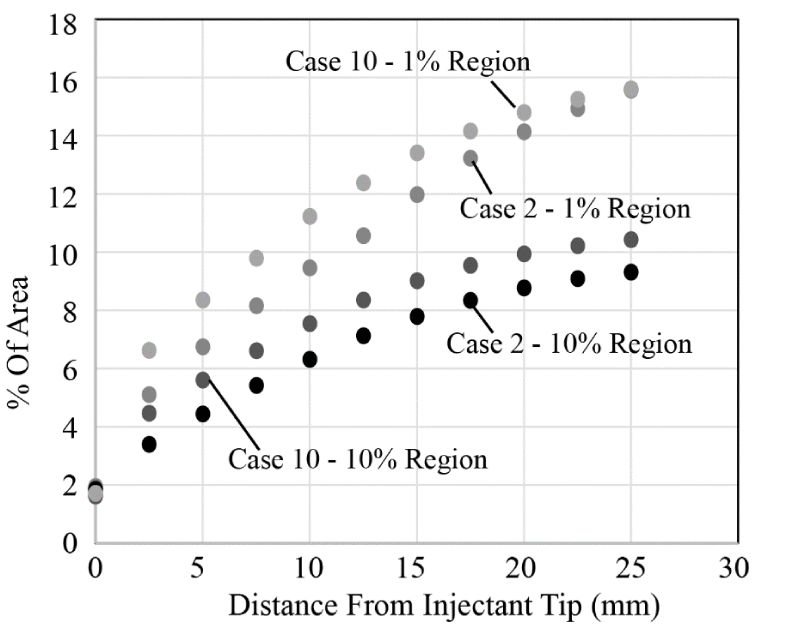
Next, attention is turned to the results from the multi-lumen catheter. First, the effect of the presence or absence of a balloon is presented. In contrast with a single lumen catheter (Figure 15), the presence of a balloon actually results in a slightly faster injectant spread downstream of the catheter. This behavior is due to the location of the multiple injection ports which are near the periphery of the catheter cross section, located where the disturbing presence of the balloon is more easily felt.
When the injectant flowrate is increased and a multi-lumen catheter is employed (Figure 18), the injectant more quickly spreads across the artery cross section. In fact, the results are similar to those already presented for the single-lumen case (Figure 16). When the injectant flow is 10ml/min, the downstream spread of injectant increases nearly linearly with downstream position.
The last dispersion comparison to be shown is the differences between the single and multi-lumen cases. There was not a universal trend for these two catheter designs; in some cases, the injectant spread quicker from the multi-lumen device whereas in other cases, the reverse occurred. Since the use of balloons is quite common in these injection procedures, it was decided to focus attention on comparing the dispersion for that situation. Figure 19 has been prepared. The figure shows that there is a modest improvement in the injectant distribution when a multi-lumen device is used. Also, when cross-sectional contours are shown, it was found that the injectant bolus was more predisposed to the arterial wall for the multi-lumen case. This finding suggests that not only is the percentage of area taken up by the injectant improved but so too is the geometric distribution.
With these results presented, it is possible to provide a summary of the single-lumen and multi-lumen injectant distribution capacities. First, the diffusivity of the injectant within the blood and the viscosity of the injectant have a negligible effect. Second for the single-lumen case, the presence of an upstream balloon reduces the injectant spread. The situation is reversed for the multi-lumen case. There, a balloon improves the injectant dispersion. For both catheter designs, increasing the injectant flow improves the dispersion, particularly at more downstream locations.
Comparison of the two catheters reveals that there is no general improvement or degradation in spread with the use of a single- or multi-lumen catheter. However, for the very common situation where an upstream balloon is used, the multi-lumen catheter is superior, not only in the occupation of cross sectional area by the injectant but also the geometric distribution of the bolus.
Impact of catheter on cell viability
The last part of the study deals with computations of potential hemolysis in the two catheters. Experimental results have already been reported and Figure 8 showed that while the multi-lumen device resisted compression and hemolysis, for high balloon inflation pressures, the single-lumen catheter lead to a significant loss of cell viability.
To test this finding, numerical simulations were performed on the fluid flowing through the catheter. The potential for hemolysis within cells is related to the level of shear stress experienced by the cells and the duration of shear. Red blood cell data has extensive literature on these hemolysis thresholds and allow the creation of a database of critical exposures. That database is reproduced in Table 2. Red blood cells will be used as the surrogate for stem cells because of this wealth of mechanical hemolysis information.
As mentioned earlier, the simulations, which are based on the equations of mass and momentum conservation, provide a continuous distribution of pressure, velocity, shear stress, and other flow variables. Integration of the shear stress along streamlines enabled a comparison of the shear stress history experienced by fluid to the critical values listed in Table 2. From that comparison, the likelihood of cellular injury from the single- or multi-lumen case could be found.
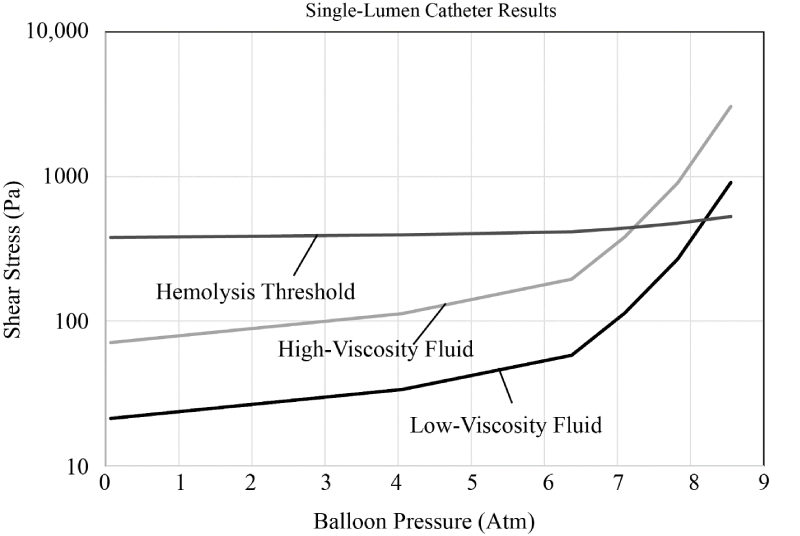
The findings for the single-lumen case are presented in Figure 20 and correspond to a 4ml/min injectant flow. The figure shows two sets of results which correspond respectively, to the low and high fluid viscosity. Also on the image, there is a hemolysis threshold – values of stress above the threshold indicate that there is a risk of stress-caused cellular damage.
According to the data displayed in the figure, the stress experienced by the cells within the fluid rise to a hemolysis threshold for balloon pressures of approximately 7-8 atm. This predictive finding matches well with the experimental results shown earlier.
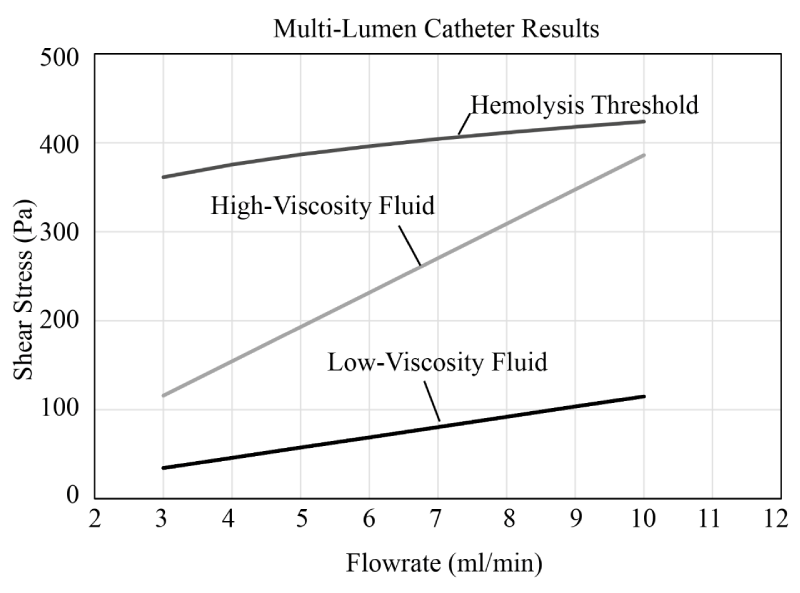
Since the multi-lumen catheter resists the compressive forces from the balloon, the counterpart study was not necessary. However, to further explore the potential for hemolysis within the multi-lumen device, a different study was performed. The injectant flowrate was sequentially increased and the shear stress and exposure durations were recorded and compared with the threshold for cellular damage. The results of that study are set forth in Figure 21. There, it is seen that the high-viscosity fluid leads to larger stresses exerted on the cells (as expected) however even for flowrates up to 10 ml/min, neither case has stress levels that reach the hemolysis threshold. This finding reinforces the earlier studies showing that the multi-lumen device does not present a risk for cellular injury.
Discussion
The results shown in this study provide some guidance for the design of catheters or for their use in medical situations. For cases where a catheter is to be used with an inflation balloon, particularly when the balloon inflation reaches values of ~7-8 atm, it is advantageous to use a multi-lumen catheter. The multi-lumen catheter is able to resist the compressive effect the balloon and it maintains the open channels for injection. One consequence of this is that there is a lower likelihood that cells injected through the catheter can become injured by shear stress.
Another finding is that for both catheters, some factors affect the dispersion of medication or stem cells downstream of the injection location. For instance, the viscosity of the carrying fluid and the diffusivity do not materially affect the dispersion. However, the presence or absence of an upstream balloon can cause an effect. Furthermore, the injectant flowrate also plays a role. Larger injectant flows give more effective dispersion.
Concluding Remarks
Here, a multiple part study was undertaken. First, two catheters used for the injection of liquids into the artery system were obtained. Then, benchtop tests were performed to determine whether the catheters present a risk to cellular damage when the injectant contains stem cells. It was discovered that when an inflation balloon is used, a single-lumen catheter is compressed and the fluid passageway is narrowed. This narrowing increases the shear stress within the injectant and can cause loss of cell viability. Such cell damage was found for balloon pressures that exceeded approximately 8 atm for an injectant flowrate of 4ml/min.
Next, a numerical model was developed to identify the factors which control the spread of injectant into the artery downstream of the injection location. It was discovered that the injectant diffusivity in blood and the carrying fluid viscosity are not important factors. The rate of injectant flowrate however can affect the percentage of downstream cross section that contains the injectant. Also, the presence of an upstream balloon impacts the dispersion but its effect depends on the type of catheter used.
Finally, the simulations were used to attempt to predict whether cellular damage has occurred. It was found that the stress within the fluid reached RBC-level hemolysis thresholds when the upstream balloon pressure rose to ~7-8 atm in the single-lumen catheter and with a 4ml/min injectant flow. This finding confirms the experimental results. Furthermore, for the multi-lumen catheter, the balloon pressure was not an influencing factor however our calculations show that the multi-lumen device leads to sub-threshold stress for flowrates up to 10 ml/min.
It is hoped that this study provides some justification for further exploration of multi-lumen injection catheters and also that the numerical simulations discussed here become used more widely as a design and evaluation tool.
- Abraham JP, Sparrow EM, Gorman EM, Stark JR, Kohler RE (2013) A Mass Transfer Model of Temporal Drug Deposition in Artery Walls. International Journal of Heat and Mass Transfer 58: 632-638. Link: https://goo.gl/L8apuE
- Stark JR, Gorman JM, Sparrow EM, Abraham JP, Kohler RE (2013) Controlling the Rate of Penetration of a Therapeutic Drug Into the Wall of an Artery by Means of a Pressurized Balloon. Journal of Biomedical Science and Engineering 6: 527-532. Link: https://goo.gl/2I23x9
- Abraham JP, Stark JR, Gorman JM, Sparrow EM, Kohler RE (2013) A Model of Drug Deposition with in Artery Walls. J Medical Devices 7: 020902. Link: https://goo.gl/bQsk4Q
- Iasiello M, Vafai K, Andreozzi A, Bianco N (2016) Analysis of non-Newtonian effects on low-density lipoprotein accumulation in an artery. Journal of Biomechanics 49: 1437-1446. Link: https://goo.gl/8MMCPM
- Iasiello M, Vafai K, Andreozzi A, Bianco N, Tavakkoli F (2015) Effects of External and Internal Hyperthermia on LDL Transport and Accumulation within an Artery Wall in the Presence of a Stenosis. Ann Biomed Eng 43: 1585-1599. Link: https://goo.gl/IESnf7
- Iasiello M, Vafai K, Andreozzi A, Bianco N (2016) Low-Density Lipoprotein Transport Through an Arterial Wall Under Hyperthermal and Hypertension Conditions – An Analytical Solution. J Biomech 49: 193-204. Link: https://goo.gl/D0lnzY
- Wang S1, Vafai K (2014) Analysis of Low Density Lipoprotein (LDL) Transport With in a Curved Artery. Ann Biomed Eng 43: 1571-1584. Link: https://goo.gl/siOGkM
- Lovik RD, Abraham JP, Sparrow EM (2008) Assessment of Possible Thermal Damage of Tissue Due to Atherectomy by Means of a Mechanical Debulking Device. ASME 2008 Summer Bioengineering Conference. Marco-Island, FL 799-800. Link: https://goo.gl/TkLvK5
- Nelson G, Majewicz A, Abraham JP (2008) Numerical Simulation of Thermal Injury to the Artery Wall during Orbital Atherectomy. ANSYS International, Pittsburgh, PA 26-29. Link: https://goo.gl/yEZ50R
- Abraham JP, Sparrow EM, Lovik RD (2008) Unsteady, Three-Dimensional Fluid Mechanic Analysis of Blood Flow in Plaque-Narrowed and Plaque-Free Arteries. International Journal of Heat and Mass Transfer 51: 5633-5641. Link: https://goo.gl/BuFwLf
- Adams GL, Khanna PK, Staniloae CS, Abraham JP, Sparrow EM (2011) Optimal Techniques with the Diamondback 360 System Achieve Effective Results for the Treatment of Peripheral Arterial Disease. J Cardiovasc Transl Res 4: 220-229. Link: https://goo.gl/BrVgvS
- Safian RD1, Niazi K, Runyon JP, Dulas D, Weinstock B, et al. (2009) Orbital Atherectomy for Infrapopliteal Disease: Device Concept and Outcome Data for the OASIS Trial. Catheter Cardiovasc Interv 73: 406-412. Link: https://goo.gl/Yhw8fr
- Shammas NW, Lam R, Mustapha J, Ellichman J, Aggarwala G, et al. (2012) Comparison of Orbital Atherectomy Plus Balloon Angioplasty vs. Balloon Angioplasty Alone in Patients with Critical Limb Ischemia: Results of the CALCIUM 360 Randomized Pilot Trial. J Endovasc Ther 19 480-488. Link: https://goo.gl/l3RYpV
- Chambers JW, Feldman RL, Himmelstein SI, Bhatheja R, Villa AE, et al. (2014) Pivotal Trial to Evaluate the Safety and Efficacy of the Orbital Atherectomy System in Treating De Novo, Severely Calcified Coronary Lesions (ORBIT II). JACC Cardiovasc Interv 7: 510-518. Link: https://goo.gl/QvrQHs
- Das T, Mustapha J, Indes J, Vorhies R, Beasley R, et al. (2014) Technique Optimization of Orbital Atherectomy in Calcified Peripheral Lesions in the Lower Extremities. Catheter Cardiovasc Interv 83: 115-122. Link: https://goo.gl/nVvdyo
- Parikh K, Chandra P, Choksi N, Khanna P, Chambers J (2013) Safety and Feasibilty of Orbital Atherectomy for the Treatment of Calcified Coronary Lesions. Catheter Cardiovasc Interv 81: 1134-1139. Link: https://goo.gl/JiK5XX
- Helgeson ZL, Jenkins JS, Abraham JP, Sparrow EM (2011) Particle Trajectories and Agglomeration/Accumulation in Branching Arteries Subjected to Orbital Atherectomy. Open Biomed Eng J. 5: 25-38. Link: https://goo.gl/sNOY42
- Plourde BD, Vallez LJ, Sun B, Nelson-Cheeseman BB, Abraham JP, et al. (2016) Alterations of Blood Flow through Arteries Following Atherectomy and the Impact on Pressure Variation and Velocity. Cardiovasc Eng Technol 7: 280-289. Link: https://goo.gl/dm4DtA
- Dib N, Kohler RE, Abraham JP, Plourde BD, Schwalbach DB, et al. (2013) TCT-811 Stem Cell Viabilitiy Significantly Reduced After Passing Through a Standard Single Lumen Over-the-Wire 0.014 Balloon Angioplasty Catheter. Journal of the American College of Cardiology 62: B246. Link: https://goo.gl/BfUI9W
- Ramazani-Red R, Chelikani S, Sparrow EM, Abraham JP (2010) Experimental and Numerical Investigation of Orbital Atherectomy: Absence of Cavitation. Journal of Biomedical Science and Engineering 3: 1108-1116. Link: https://goo.gl/LtxA1m
- Heuser RR (2014) Treatment of Lower Extremeity Vascular Diseases: The Diamondback 360 Orbital Atherectomy System. Expert Rev Med Devices 5: 279-286. Link: https://goo.gl/C3ZiUx
- Korabathina R, Mody KP, Yu J, Han SY, Patel R, et al. (2010) Orbital Atherectomy for Symptomatic Lower Extremity Disease. Catheter Cardiovasc Interv 76: 326-332. Link: https://goo.gl/LDNe6x
- Dattilo R, Himmelstein SI, Cuff RF (2014) The COMPLIANCE 360 Trial, A Randomized, Prospective, Multicenter, Pilot Study Comparing Acute and Long-Term Results of Orbital Atherectomy to Balloon Angioplasty for Calcified femoropopliteal Disease. J Invasive Cardiol 26: 355-360. Link: https://goo.gl/fjIRh4
- Makam P (2013) Use of Orbital Atherectomy Treatment in a High-Volume Clinical Practice Modifies Non-Compliant Plaque to Deliver Durable Long-Term Results. J Invasive Cardiol 25: 85-88. Link: https://goo.gl/vXLFh0
- Dib D, Abraham JP, Plourde BD, Schwalbach DB, Dana D, et al. (2014) TCT-155 A Novel Multi Lumen Compliant Balloon Catheter (ND Infusion Catheter) Preserves Stem Cell Viability and Improves Dispersion When Compared to a Standard Single Lumen Balloon Angioplasty Catheter. J Am Coll Cardiol 64: 11. Link: https://goo.gl/xHBPQt
- Vallez LJ, Sun B, Plourde BD, Abraham JP, Staniloae CS (2015) Numerical Analysis of Arterial Plaque Thickness and its Impact on Artery Wall Compliance. J Cardiovasc Med Cardiol 2: 26-34. Link: https://goo.gl/CkQhjP
- Tang D, Yang C, Huang Y, Ku DN (1999) Wall Stress and Strain Analysis Using a Three-Dimensional Thick-Wall Model with Fluid-Structure Interactions for Blood Flow in Carotid Arteries with Stenosis. Computers and Structures 72: 341-356. Link: https://goo.gl/kcbl1f
- Tang D, Yang C, Huang Y, Ku DN (1999) A 3-D Thin-Wall Model with Fluid-Structure Interactions for Blood Flow in Carotid Arteries with Symmetric and Asymmetric Stenosis. Computers and Structures 72: 357-377. Link: https://goo.gl/FuVzwn
- Tang D, Yang C, Walker H, Kobayashi S, Ku DN (2002) Simulating Cyclic Artery Compression Using a 3D Unsteady Model with Fluid-Structure Interactions. Computers and Structures 80: 1651-1665. Link: https://goo.gl/ezOYec
- Tang D, Yang C, Kobayashi S, Zheng J, Vito RP (2003) Effect of Stenosis Asymmetry on Blood Flow and Artery Compression: A Three-Dimensional Fluid-Structure Interaction Model. Ann Biomed Eng 31: 1182-1193. Link: https://goo.gl/LNTZRp
- Tang D, Yang C, Kobayashi S, Ku DN (2004) Effect of a Lipid Pool on Stress/Strain Distributions in Stenotic Arteries: 3-D Fluid-Structure Interactions (FSI) Models. J Biomech Eng 126: 363-370. Link: https://goo.gl/nI3mEQ
- Abraham JP, Plourde BD, Sun B, Vallez LJ, Staniloae CS (2015) The Effect of Plaque Removal on Pressure Drop and Flowrate Through a Stenotic Lesion. Biology and Medicine 8: 1000261. Link: https://goo.gl/nf4sKz
- Sun B, Vallez LJ, Plourde DB, Stark JR, Abraham JP (2015) Influence of Supporting Tissue on the Deformation and Compliance of Healthy and Diseased Arteries. Journal of Biomedical Science and Engineering 8: 490-499. Link: https://goo.gl/i6Ib44
- Torii R, Oshima M, Kobayashi T, Takagi K, Tezduyar TE (2006) Fluid-Structure Interaction Modeling of Aneurysmal Conditions with High and Normal Blood Pressures. Computational Mechanics 38: 482-490. Link: https://goo.gl/UDlPuy
- Torii R, Oshima M, Kobayashi T, Takagi K, Tezduyar TE (2007) Influence of Wall Elasticity in Patient Specific Hemodynamic Simulations. Computers and Fluids 36: 160-168. Link: https://goo.gl/SRG3WJ
- Schwalbach DB, Plourde BD, Abraham JP, Kohler RE (2013) Drug Dispersion for Single- and Multi-Lumen Catheters. Journal of Biomedical Science and Engineering 6: 1021-1028. Link: https://goo.gl/NfekRJ
- Plourde BD, Schwalbach DB, Abraham JP, Kohler RE (2014) Intracoronary Injection of Medication from multi-lumen injection Catheters. Journal of Medical Devices 8: 020901. Link: https://goo.gl/T2N9tk
- Dib N, Schwalbach DB, Plourde BD, Kohler RE, Dana D, et al. (2014) Impact of Balloon Inflation Pressure on Cell Viability with Single and Multi Lumen Catheters. J Cardiovasc Transl Res 7: 781-787. Link: https://goo.gl/iqktPc
- Naughton nm, Plourde BD, Stark JR, Hodis S, Abraham JP (2014) Impacts of Waveforms on the Fluid Flow, Wall Shear Stress, and Flow Distribution in Cerebral Aneurysms and the Development of a Universal Reduced Pressure. Journal of Biomedical Science and Engineering 7: 7-14. Link: https://goo.gl/ECPTvl
- Walburn FJ, Schneck DJ (1976) A Constitutive Equation for Whole Human Blood. Biorheology 13: 201-210. Link: https://goo.gl/LnZTAy
- J.P. Abraham, and E.M. Sparrow (2006) Simulation of fluid flow through a trauma fluid-warming device, laboratory for heat transfer and fluid flow practice. Report AZ-1.
- Blackshear P (1972) Hemolysis at prosthetic surfaces. In: Biomechanics, Its Foundations and Objectives. edited by Fung Y, Prentice Hall, Englewood Cliffs. Link: https://goo.gl/JDNmEL
- Blackshear P, Blackshear G (1987) Mechanical hemolysis, in: Handbook of Bioengineering. edited by Skalak R, Chien S, McGraw-Hill, New York, NY.
- Lu PC, Lai HC, Liu JS (2001) A Reevaluation and Discussion on the Threshold Limit for Hemolysis in a Turbulent Shear Flow. J Biomech 34: 1361-1364. Link: https://goo.gl/niY6N9
- Grigioni M, Daniele C, D'Avenio G, Barbaro V (1999) A Discussion on the Threshold Limit for Hemolysis Related to Reynolds Shear Stress. J Biomech 32: 1107-1112. Link: https://goo.gl/KsBs5O
- Williams AR, Hughes DE, Nyborg WL (1970) Hemolysis near a Transversely Oscillating Wire. Science 169: 871-873. Link: https://goo.gl/eWmW2o
- Bacher RP, Williams MC (1970) Hemolysis in Capillary Flow. J Lab Clin Med 76: 485-496. Link: https://goo.gl/wKC7Qq
- JA Rooney (1970) Hemolysis Near and Ultrasonically Pulsating Gas Bubbles. Science 169: 869-871. Link: https://goo.gl/IHi3kk
- Paul R, Apel J, Klaus S, Schügner F, Schwindke P (2003) Shear Stress Related Blood Damage in Laminar Couette Flow. Artif Organs 27: 517-529. Link: https://goo.gl/QjcYg3
- Sallam AM, Hwang NH (1948) Human Red Blood Cell Hemolysis in a Turbulent Shear Flow. Contribution of Reynolds Shear Stress, Biorheology 21: 783-797. Link: https://goo.gl/uKFtV6
- Wurzinger LJ, Opitz R, Blasberg P, Schmid-Schönbein H (1985) Platelet and coagulation parameters following millisecond exposure to laminar shear stress. Thromb Haemost 54: 381-386. Link: https://goo.gl/6hCqHt
- Sutera S, Mehrjardi M (1975) Deformation and Fragmentation of Human RBC in Turbulent Shear Flow. Biophys J 15: 1-10. Link: https://goo.gl/udXCFv
- Leverett L, Hellums J, Alfrey C, Lynch B (1972) Red Blood Cell Damage by Shear Stress. Biophys J 12: 257-273. Link: https://goo.gl/ANCvZP
- Shapiro S, Williams M (1970) Hemolysis in Simple Shear Flows. Am Inst Chem Enginee16: 575-580. Link: https://goo.gl/zziCIX
- Steinbach J (1970) Hemolysis at Tube Walls, PhD Thesis. University of Minnesota. Minneapolis.
- Knapp CF, Yarbrough (1968) An Experimental Investigation of Mechanism of Hemolysis in Couette Flow. PhD Thesis, Notre Dame University, Indiana.
Article Alerts
Subscribe to our articles alerts and stay tuned.
 This work is licensed under a Creative Commons Attribution 4.0 International License.

 Save to Mendeley
